Search computers still relevant to specified action (baseline)

Hello guys,

I would like to know if any of you know how can I create an analysis or utilize web reports to generate a report for computers who are still relevant to an applied baseline.

Here’s an explanation:

  • We have a tight schedule to send actions to production environment.
  • We create baselines and we send in a short window of 5 hours.
  • We get in trouble trying to generate a report of how that activity went. How many computers are fixed and how many of them failed and the exit code.

Not only that but some of our baselines include a lot of content and it’s terrible to identify computers who are still relevant to that baseline once it was sent.[

Is there any way, through analysis, relevance statement, web reports etc where I can make it work?
We kind of need to make a report of all equipment that does not comply with their appropriate baselines.

Thank you.

What kind of deployment size are you dealing with? I have some Session relevance I’ve used in Web Reports before, but I’m hesitant to publish because it’s not performant at larger scales (100k+ endpoints)

We currently have around 3500 computers in our environment.

Ok I’ve cleaned up something a bit that I think you could use as an example. I’ve posted a Web Report on my github page at https://raw.githubusercontent.com/Jwalker107/BigFix/master/Test%20Content/Web%20Reports/dataTables%20-%20Action%20Details%20Report.beswrpt

Building on the earlier examples I posted into the same repo at GitHub - Jwalker107/BigFix: BigFix Samples and working tools, this Web Report runs a Session Relevance query to pull the per-action results from every computer, and uses dataTables.js to render the results into a sortable, searchable, filterable table. The normal Web Reports functions for Filtering by computer or action can also be used.

Because this is a fully-custom report, the options to Add/Remove/Expand columns are not possible. To add or remove columns you’d have to use the ‘Edit Source’ button and modify the two Session Relevance queries that are used. One query builds the names of the column headers, the second query supplies all the row data. The number of columns must be consistent, both queries have to return the same number of cells or dataTables will not render the table correctly.

As with all unofficial content, this is provided ‘as-is’, without support. It’s an example I hope will be useful, and I’ll be happy to answer questions about it, but our Support team won’t have any info about this report.

Just so we have it attached in the forum, the Session Relevance I’m using to drive the query result is

(
item 4 of it as string/* computer id */
, item 5 of it /* computer name */
, item 3 of it /* computer groups string */
, ((if group member flag of it then id of parent group of it as string else "") of item 1 of it as string | "")
, ((if group member flag of it then link of parent group of it  else "" as html) of item 1 of it  | "" as html)
, id of item 1 of it as string | ""
, link of item 1 of it | "" as html
, name of issuer of item 1 of it | ""
, time issued of item 1 of it as string | ""
, status of item 2 of it as string | ""
, exit code of item 2 of it as string | ""
, end time of item 2 of it as string | ""
) of
(
item 0 of it /* computer */
, action of item 1 of it /* action */
, item 1 of it /* action result */
, item 2 of it /* computer groups */
, item 3 of it /* computer id */
, item 4 of it /* computer name */
) of 
(
item 0 of it /* computer object */
, action results of item 0 of it /* action results for computer */
, item 1 of it /* computer groups */
, item 2 of it /* computer id */
, item 3 of it /* computer name */
) of
(
it
, (concatenation ";" of names of bes computer groups of it | "None") /* computer groups is expensive - so only lookup once per computer*/
, id of it as string | "No computer ID"
, link of it | "Unknown" as html
) of
(
bes computers
)

I went through several permutations trying to find the most efficient ways to look up Action Results, and starting from the ‘bes computer’ was the most efficient form I was able to find. I’m certainly open to suggestions if anyone can find improvements on it, as I said it does have trouble when scaling into the tens of thousands of computers.

4 Likes

Thank you for the help! I’ll test it out and see if it works!

I’m really new to the Web Reports. Could you please provide me with some knowledge about it?

How can I insert the relevance and generate this report within the web reports page.

Cheers!

There is a very trivial example here - Creating a Custom Report

From there, just use the sessin relevance documentation - https://developer.bigfix.com/relevance/guide/session/

It can quickly get a lot more complex with the full stack of Session Relevance, HTML, CSS & Javascript

If you aren’t sure about how to import Jason’s report, there are threads in the forum - this one should help

What I posted is a complete report that can be imported directly. First if you’re not familiar with GitHub, check my post at Tips: Downloading files from GitHub for how to download the raw report from GitHub. It should be saved as a “.beswrpt” file, which contains XML text.

On the Web Reports server, you must first allow Custom Reports if it is not already enabled. See Creating a Custom Report for more detailed instructions, the basics are

Take note that, if you have a brand new installation of the product, the import or save of custom reports is disabled by default. To import or save custom reports, the product administrator must set the value of key AllowCustomReportCreation to 1. Also the view of custom reports to non-administrator users is disabled by default. To allow any user to view custom reports, the product administrator must set the value of key AllowUserViewCustom to 1. Depending on your installation, these registry keys can be found in:

On Windows operating systems:
HKLM\Software\WOW6432Node\BigFix\Enterprise Server\BESReports

On Linux operating systems:
In the configuration file /var/opt/BESWebReportsServer/beswebreports.config, section [Software\BigFix\Enterprise Server\BESReports]

When Custom Reports are enabled, two new options will appear. Under ‘Explore Data’, you’ll have a ‘Custom’ option. This would allow you to create a fully custom report by generating your own HTML content, including rendering Session Relevance using the special tag like Computer Count: <?Relevance number of bes computers ?>

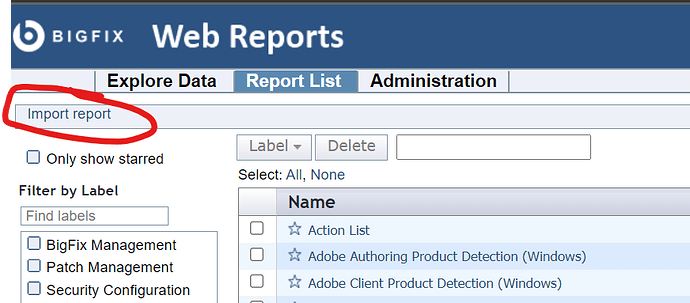
And under the Report List, you’ll have a new ‘Import report’ link:

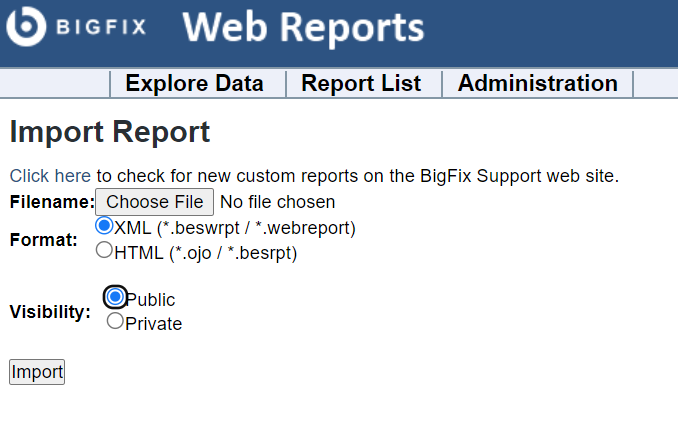
Use the ‘Import Report’ link, browse to the report you downloaded from my GitHub,

image, select the ‘XML’ format, and whether you want to make the report Public (visible to everyone) or Private (visible only to your own Web Reports account), and click Import.
@JasonWalker Thank you for the help.

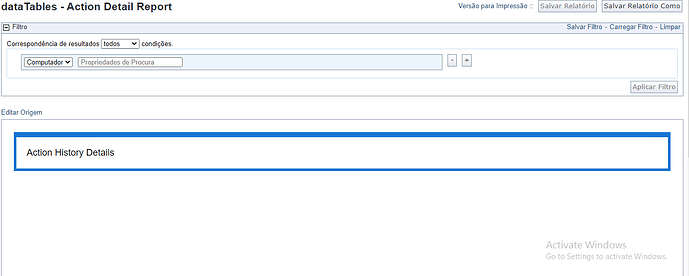
I followed all the steps and managed to import the .xml file, but no results were shown:

There’s just an empty screen, but it does not return any computers.

Do I need to adjust anything on the xml file so that results can be generated based in my environmnent?

Thanks in advance.

Let me look into it on my side. I’ll probably have some tests for you to run in the Explore Data -> Custom area in a couple of hours.

Is your browser able to reach the Internet, or are you airgapped? My report has references to the data tables CDN links for scripts. If you’re airgapped we’ll need you to download the JavaScript files to your Web Reports server and adjust the links in the report.

As far as I’m concerned, there is access to the internet, I can even navigate through this forum. But it is possible that there are some blocks over unknown content on out firewall side.
Do you have any specific IP addresses or URLs that needs to be added to exclusion?

Thank you.

--------EDITED------

@JasonWalker I was able to get some results after trying in another smaller environment (10.0.9), (around 2100 computers and less actions applied).
The previous environment (10.0.7) I was trying has 3500 computers and it has more than 500 actions issued. Could it be the reason?

If the reason is the environment size, then I’m in trouble haha, but if it is firewall I can talk to the Security guys and see if they can help me out.[

Thank you.

Let’s try a few test queries.
In the Explore → Custom area, try each of these and hit ‘preview’, should see results in the bottom pane.

  1. Simple list of column headers

<?relevance concatenation of ps of substrings separated by ";" of "Computer ID;Computer Name;Computer Groups;Parent Action ID;Parent Action Name;Action ID;Action Name;Issuer;Time Issued;Result;Exit Code;End Time" ?>

  1. Small list of computer properties

     <?relevance
    
     (
      (concatenation ";" of names of bes computer groups of it | "None") /* computer groups is expensive - so only lookup once per computer*/
     , id of it as string | "No computer ID"
     , link of it | "Unknown"  as html
     ) of
     (
     bes computers
     )
     ?>
    
  2. Count of action results

<?relevance
number of
(
item 0 of it /* computer object */
, action results of item 0 of it /* action results for computer */
, item 1 of it /* computer groups */
, item 2 of it /* computer id */
, item 3 of it /* computer name */
) of
(
it
, (concatenation ";" of names of bes computer groups of it | "None") /* computer groups is expensive - so only lookup once per computer*/
, id of it as string | "No computer ID"
, link of it | "Unknown" as html
) of
(
bes computers
)

?>

I originally built this with a fairly large customer, but I admit I’ve added some properties since then that I haven’t tested on a larger environment yet. If you can let me know whether these give results, and if any of the queries are extremely slow, I think that would be helpful in figuring out whether there’s a bottleneck.

On the larger environment, which is the one I need to generate these reports I got the following results:

The first query return some results. The second one returned a large result fast, but the browser struggled a bit to navigate through the webpage.
The third, on the other hand, got some time processing, I guess, and returned the following: “219241”

The report is running pretty good on the smaller environment, it’s a well-done job, I was able to find everything I was looking for and generate really great reports about some actions we did last month.

Ok,the third query tells me that the action lookups are working in your environment, and eventually should build a table of two hundred thousand rows.
How long have you allowed for the custom report to load? I’d like to try giving it a really long time, like fifteen minutes, and see whether it loads eventually. Just so I know whether to work on the efficiency, or compatibility.

It’s been a couple of years since I looked at it, but at 150k endpoints with something like 20k actions on average, it took a half hour to load. Not acceptable for wider publication, but in that case they just needed a daily archived report so we just set it up as a scheduled report and viewed the archived output when needed.

I’m considering changing my approach on this report. Could you try this in a custom report and let me know how long it takes and what the count is?

<?relevance
number of 
 (
  (
   id of computer of it as string
   , link of computer of it | "No Name" as html
   , (if group member flag of action of it then link of parent group  of action of it else "" as html) 
   , id of action of it as string
   , link of action of it
   , name of issuer of action of it
   , time issued of action of it as string
   , status of it as string
   , exit code of it as string | ""
   , end time of it as string | ""
  ) of results of it
   ;
  (
   if (exists targeted computer set of it) then 
    (
    id of item 0 of it as string /* non-reported computer id */
    , link of item 0 of it | "<computer deleted>" as html
    , (if group member flag of item 1 of it then link of parent group  of item 1 of it else "" as html) | "" as html
    , id of item 1 of it as string
    , link of item 1 of it | "" as html
    , name of issuer of item 1 of it | ""
    , time issued of item 1 of it as string
    , "Not Reported"
    , "" /* exit code */
    , "" /* end time */
   ) of (elements of (targeted computer set of it - reported computer set of it), it ) else nothing
  ) of it
 )
of bes actions
?>

Hello @JasonWalker , I’m sorry for the delay.

Coincidence or not I tried to run the dataTables report today again, but I waited for 2h and it didn’t return any results.

Now about your new approach, I pasted this query on the custom report and got the following.

It took about 10 seconds to return the following result:

  • 425625

Not sure what this number means.

Thank you.

This relevance I’m toying with,would have retrieved both action results, and rows for computers that were targeted by an action but have not (yet) reported a result on the action.

That count 425,625 is the number of rows that would have been in the report, if we had let it run.

That’s a pretty high row count, and I could envision the Web Reports server, or the browser, or both struggling with it. Just in terms of strings, if there are a hundred characters on each row (and there are probably more), then that’s about 45 MB of text - even before JavaScript starts trying to sort or filter it.

(Maybe I’m starting to find out why web Reports doesn’t have an out-of-box Action Results report)

edit: Looking at my sample data, each row is about 700 bytes long, so … your result would have been about 300 MB of text if I’m counting correctly.

I’ve just posted a new report that might be possible, at BigFix/Test Content/Web Reports/dataTables - Action Details Report by Action with Filters.beswrpt at master · Jwalker107/BigFix · GitHub

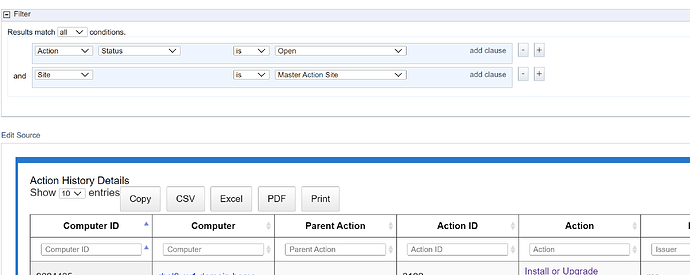
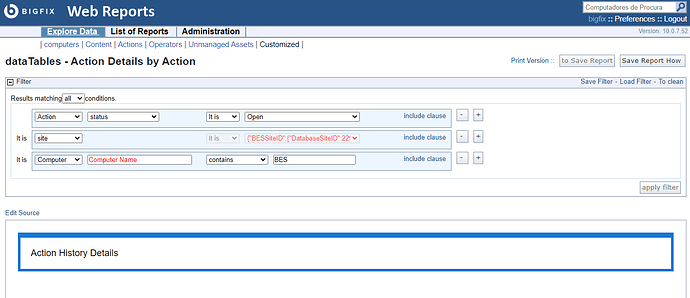
This one has filters at the top of the page, by default to only show results for actions that are still Open and were issued by a Master Operator. You can add filters or modify these, but with the numbers of action results you’re showing I think the server and browser would struggle to report everything.

With an average of 121 actions reported by each computer, I think you may also want to check into whether you’re cleaning up stopped & expired actions, or how long you should be keeping them before deleting old actions.

Hello @JasonWalker.

I imported the new one, but I’m still not getting any results. As you can see (translated page):

Interesting point is that some filters are in red. Are there any lines that I should modify in order to suit my environment?

Thank you.

Try deleting the two filters in red. The filter saved in the web report would have site IDs that are only valid for my lab. The site I was filtering for was “Master Action Site”