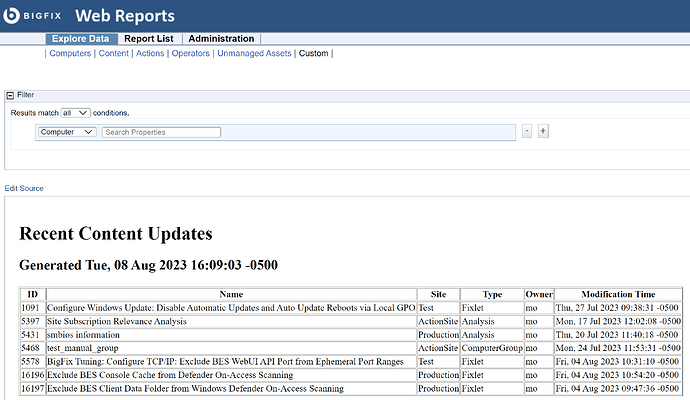
Ok, if you don’t have a ‘Custom’ report option in Web Reports under Explore Data, , see Search computers still relevant to specified action (baseline) - #8 by JasonWalker for how to enable Custom Reports.
If you already have the Custom option, you can build your entire HTML report from scratch. Some of my more complex reports use dataTables.JS for fancier presentation but you can actually prepare the HTML directly by embedding the special <?relevance > tag inside the HTML. Everything between <?relevance and the closing > will be interpreted by the session relevance engine and inserted into the HTML before the page is rendered. And the relevance content can be split across lines, the spacing doesn’t matter to the engine.
Here’s the entire content of ‘Edit Source’ I’m using to test this report, you should be able to just shorten the days to 3 instead of the 30 that I’m using.
<H1> Recent Content Updates </H1>
<H2> Generated <?relevance now ?> </H2>
<p>
<?relevance
    table "border=all" of
       concatenation of (
           thead of concatenation of trs of (
                    concatenation of ths of ("ID"; "Name"; "Site";"Type";"Owner";"Modification Time")
                    )
          ; concatenation of trs of (
               concatenation of tds of (
                    item 0 of it as string; item 1 of it as string; item 2 of it as string; item 3 of it as string; item 4 of it as string; item 5 of it as string
                    )
                    ) of (
                        id of it
                       , name of it
                       , name of site of it
                       , type of it
                       , name of issuer of it
                       , modification time of it
                        ) of custom bes fixlets whose (now - modification time of it < 30 * day)
        )
?>
The rendered page would look something like
