Example: Custom Web Report with Pie Chart

The following is an example of a custom webreport with a pie chart using highcharts.

It should be possible to replace bes properties "Agent Version" with any single property and it should result in a pie chart.

<script src="https://code.highcharts.com/highcharts.js"></script>
<script src="https://code.highcharts.com/modules/data.js"></script>
<script src="https://code.highcharts.com/modules/exporting.js"></script>

<div id="container" style="min-width: 310px; height: 400px; max-width: 600px; margin: 0 auto"></div>
<br/><br/>
<br/><br/>
<?relevance ( table "id=%22datatable%22" of ( (thead of concatenations "" of tr of (th of "" & th of name of it)) & tbody of concatenations "" of trs of (th of item 1 of it & td of (it as string) of item 0 of it) of (multiplicity of it, it) of unique values of values of results of it ) of bes properties "Agent Version" ) ?>

<script>
$(function () {
    $('#container').highcharts({
        data: {
            table: 'datatable'
        },
        chart: {
            type: 'pie'
        },
        title: {
            text: ''
        },
        tooltip: {
            formatter: function () {
                return '<b>' + this.series.name + '</b><br/>' +
                    this.point.y + ' of ' + this.point.name.toLowerCase();
            }
        }
    });
});
</script>

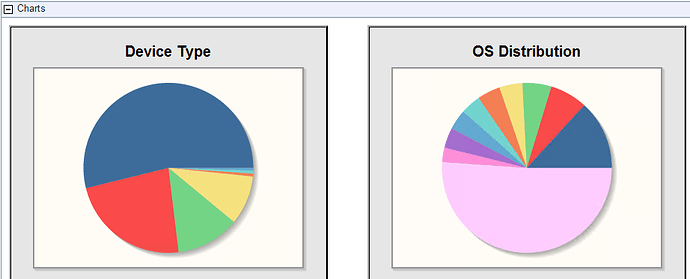
Example Output:

4 Likes

I took this a step further, by creating the content of the webreport dynamically using session relevance.

This allows as many charts as desired to be in the same webreport by changing this part below: (bes properties "Device Type"; bes properties "Agent Version")

<script src="https://code.highcharts.com/highcharts.js"></script>
<script src="https://code.highcharts.com/modules/data.js"></script>
<script src="https://code.highcharts.com/modules/exporting.js"></script>

<?relevance (html "<div id=%22" & item 3 of item 0 of it & html "%22 style=%22min-width: 310px; height: 400px; max-width: 600px; margin: 0 auto%22></div>" & item 1 of it & html "<script> $(function () { $('#" & item 3 of item 0 of it & html "').highcharts({ data: { table: '" & item 2 of item 0 of it & html "' }, chart: { type: 'pie' }, title: { text: '" & item 1 of item 0 of it & html "' }, tooltip: { formatter: function () { return '<b>' + this.series.name + '</b><br/>' + this.point.y + ' of ' + this.point.name.toLowerCase(); } } }); }); </script>") of (it, div "style=%22display:none%22" of (it & html "</table>") of (html "<table id=%22" & item 2 of it & html "%22>" & (thead of concatenations "" of tr of (th of "" & th of name of item 0 of it)) & tbody of concatenations "" of trs of (th of item 1 of it & td of (it as string) of item 0 of it) of (multiplicity of it, it) of unique values of values of results of item 0 of it)) of (item 0 of it, item 1 of it, "datatable" & item 2 of it, "container" & item 2 of it) of (item 0 of it, item 1 of it, (preceding text of first " " of item 1 of it | item 1 of it) ) of (it, name of it) of (bes properties "Device Type"; bes properties "Agent Version") ?>

This could be used to build an “executive dashboard” of arbitrary charts.


This goes 1 step further and just wraps it all in relevance:

<?relevance (html "<script src=%22https://code.highcharts.com/highcharts.js%22></script><script src=%22https://code.highcharts.com/modules/data.js%22></script><script src=%22https://code.highcharts.com/modules/exporting.js%22></script>" & it) of (html "<div id=%22" & item 3 of item 0 of it & html "%22 style=%22min-width: 310px; height: 400px; max-width: 600px; margin: 0 auto%22></div>" & item 1 of it & html "<script> $(function () { $('#" & item 3 of item 0 of it & html "').highcharts({ data: { table: '" & item 2 of item 0 of it & html "' }, chart: { type: 'pie' }, title: { text: '" & item 1 of item 0 of it & html "' }, tooltip: { formatter: function () { return '<b>' + this.series.name + '</b><br/>' + this.point.y + ' of ' + this.point.name.toLowerCase(); } } }); }); </script>") of (it, div "style=%22display:none%22" of (it & html "</table>") of (html "<table id=%22" & item 2 of it & html "%22>" & (thead of concatenations "" of tr of (th of "" & th of name of item 0 of it)) & tbody of concatenations "" of trs of (th of item 1 of it & td of (it as string) of item 0 of it) of (multiplicity of it, it) of unique values whose(multiplicity of it > 10) of ("'" & it & "'") of (it as string as trimmed string) of values of results of item 0 of it)) of (item 0 of it, item 1 of it, "datatable" & item 2 of it, "container" & item 2 of it) of (item 0 of it, item 1 of it, (preceding text of first " " of item 1 of it | item 1 of it) ) of (it, name of it) of (bes properties "Device Type"; bes properties "Agent Version"; bes properties "RAM"; bes properties "Distance to BES Relay" ) ?>
1 Like

I wish I had more time to check this out and try this…

Maybe I’ll make time for it, seems usefully and is a demand from our business to have more visible custom reports. Thanks man!

1 Like

There really isn’t anything that you need to do to try it. Just copy and paste into a custom web report, then adjust the BES Properties that it uses.

The biggest issue is that it doesn’t work well with all BES Properties, either because they return multiple results or they return very unique results.

The other issue is that many properties are OS specific, so you have to create a web report that is OS specific using the computer filters and then use that one for BES Properties that are more specific to that OS.

In general, I think it would be useful to make more universal properties for this type of use.

1 Like

How could I get this to work on a network without internet access?

The webreports server is already a webserver, so you should just be able to download the .js files and placing them in the right place on the webreports server, and then referencing them correctly in the HTML. There are probably other example webreports that do the same thing.

I was having issues with it. Is there a particular directory that the .js files should be in?

I actually don’t know what the best practices for something like this are.

The .js files need to be placed somewhere in the wwwroot folder of the Web Reports server, which is generally ???\BESReportsServer\wwwroot

Then the JavaScript files need a relative path that matches their location within that wwwroot folder. I would recommend putting them in something like BESReportsServer\wwwroot\JavaScript\_Custom in which case you would refer to their relative location as something like: /JavaScript/_Custom/highcharts/highcharts.js

You should also be able to refer to the file using an absolute path, like this: http://bigfix:888/JavaScript/_Custom/libraryname/test2.js

I just tested this, and it worked using a test file.

Did you ever get this to work for you?

I wrapped this up into a dashboard: https://github.com/jgstew/bigfix-content/blob/master/dashboards/ReportingPieCharts.ojo

The dashboard also relies on internet access to function, but only on the system that is running the BigFix Windows Console. It would be relatively easy to download the javascript libraries, include them in the same site as the dashboard, then change the <script> tags to use the local copy.

I have been looking into the idea of having the dashboards and webreports I create use an internet copy if it can, and then fall back to trying a local resource location if it cannot.

1 Like

Interesting…I hadn’t noticed this before!

Out of curiosity though, any particular reason to leverage this over the existing capabilities within Web Reports (which also allow pie charts, as well as multiple charts on a given report)? At least for the use case associated with property-based charts…

For reference: IBM Documentation

1 Like

Yes, the main reason is if you want to calculate values in javascript or do other more advanced things.

I needed to be able to recreate the Pie Charts in a custom web report. This allows the replication of that functionality in a custom web report.

I didn’t create this functionality for the examples provided.

1 Like

This is the reason I did the above: https://github.com/jgstew/bigfix-content/blob/master/dashboards/IntelVproStatus.ojo (I just made this available)

It requires an analysis to be activated and I think a policy action to be running to query the Intel vPro state.

The analysis returns the “last checked date” but I wanted to provide the calculated value of how many days since that time has passed, but that needs to be dynamically calculated in relevance or javascript. There isn’t an option to display days since in a standard webreport with property results, but it would be handy if that option existed. The same is true for Analysis results. You don’t want to calculated the days since something happened with client side relevance, because that value is wrong until the next time the client sends a new value in a report, and then it is immediately wrong again until the next… perpetually wrong for offline machines.

Does webreports server require to access to https://code.highcharts.com ? or Is it enough that the computer we opened webreports can access this address ?

1 Like

The computer that loads the report should be able to access the external URL.

1 Like

I have come up with a unique solution to the problem of external javascript libraries being used within WebReports or Dashboards on systems without Internet Access.

@selimgoksu You are correct, it is the computer that has WebReports loaded in the browser that needs internet access, not the WebReports server itself, which makes this normally not a big deal.


As far as I know the solution I have come up with is the only method by which you can easily share a single copy of an external javascript library between dashboards in multiple sites in the BigFix Console as well as between multiple WebReports servers.

The solution is based upon the concept used for the “Parameterized Fixlet Library” and Parameterized Fixlets.

You import a specially crafted BigFix Task into the BigFix console that contains the Javascript library within it. See this example: https://github.com/jgstew/bigfix-content/blob/master/fixlet/javascript/Shared%20Javascript%20Library%20-%20d3.min.js%20-%203.5.17.bes

Then you use a session relevance query that gets the source from the BigFix Task and puts it in the Dashboard and/or WebReport. I also have the session relevance fall back to getting the Javascript library from the internet so that it will still work if the BigFix task is missing:

When you actually use the session relevance within a WebReport or Dashboard, it looks like this:

<?Relevance (html it) of ( ( unique value of (it as string) of ( html tag ("script", attr list of ("title", item 0 of it & " " & item 1 of it), (html it) of item 2 of it ) ) of (name of mime fields whose(name of it ends with ".js") of it, mime field "version" of it, value of mime fields whose(name of it ends with ".js") of it) of bes tasks whose(exists mime fields "version" whose(it="3.5.17") of it AND name of it starts with "Shared Javascript Library" AND exists mime fields "d3.min.js" of it) ) | "%3Cscript src=%22https://cdnjs.cloudflare.com/ajax/libs/d3/3.5.17/d3.js%22 integrity=%22sha256-gfQwA6PlkZsLqWu4bU4hXPrbTqzixm0B5MdvBLI+Oas=%22 crossorigin=%22anonymous%22>%3C/script>" ) ?>

Which would replace <script src="https://cdnjs.cloudflare.com/ajax/libs/d3/3.5.17/d3.js" integrity="sha256-gfQwA6PlkZsLqWu4bU4hXPrbTqzixm0B5MdvBLI+Oas=" crossorigin="anonymous"></script> in my existing dashboards.

When the WebReport or Dashboard is loaded, the <?Relevance ?> results are placed inline in the HTML before it is actually ever seen by the Browser, so the Browser actually sees just a normal script tag that contains the entire contents of the javascript library within it, or it gets a script tag that references the internet javascript CDN if the task doesn’t exist in the console.

The added benefit of this approach is that it should cause the browser to render the Dashboard/WebReport faster.

Another benefit to this approach is that when you are debugging a Console Dashboard, you can “view source” in the console, copy all of the HTML, then open it in another browser like Chrome, which allows you to use Chrome’s javascript debugging tools to make sense of what is going on. I have found this approach invaluable.

The same concept should apply to CSS, but with slightly different usage.
2 Likes

I have taken this a step further and have relevance that creates relevance. It takes as input a URL to a javascript library and it outputs the session relevance needed for including it in a dashboard / webreports that would work either by loading it from a BigFix task if it exists, or an internet CDN: https://bigfix.me/relevance/details/3019262

Q: ("<?Relevance " & it & " ?>") of ("(html it) of ( ( unique value of (it as string) of ( html tag (%22script%22, attr list of (%22title%22, item 0 of it & %22 %22 & item 1 of it), (html it) of item 2 of it ) ) of (name of mime fields whose(name of it ends with %22.js%22) of it, mime field %22version%22 of it, value of mime fields whose(name of it ends with %22.js%22) of it) of bes tasks whose(exists mime fields %22version%22 whose(it=%22" & item 1 of it as string & "%22) of it AND name of it starts with %22Shared Javascript Library%22 AND exists mime fields whose(%22" & item 0 of it as string & "%22 = name of it) of it) ) | %22" & item 2 of it as string & "%22 )") of (following text of lasts "/" of it, it as version as string, (html tag ("script",attr list of ("src", it), "" ) ) of it) of ("https://cdnjs.cloudflare.com/ajax/libs/nvd3/1.8.5/nv.d3.min.js"; "https://cdnjs.cloudflare.com/ajax/libs/d3/3.5.17/d3.min.js")
A: <?Relevance (html it) of ( ( unique value of (it as string) of ( html tag ("script", attr list of ("title", item 0 of it & " " & item 1 of it), (html it) of item 2 of it ) ) of (name of mime fields whose(name of it ends with ".js") of it, mime field "version" of it, value of mime fields whose(name of it ends with ".js") of it) of bes tasks whose(exists mime fields "version" whose(it="1.8.5") of it AND name of it starts with "Shared Javascript Library" AND exists mime fields whose("nv.d3.min.js" = name of it) of it) ) | "<script src="https://cdnjs.cloudflare.com/ajax/libs/nvd3/1.8.5/nv.d3.min.js"></script>" ) ?>
A: <?Relevance (html it) of ( ( unique value of (it as string) of ( html tag ("script", attr list of ("title", item 0 of it & " " & item 1 of it), (html it) of item 2 of it ) ) of (name of mime fields whose(name of it ends with ".js") of it, mime field "version" of it, value of mime fields whose(name of it ends with ".js") of it) of bes tasks whose(exists mime fields "version" whose(it="3.5.17") of it AND name of it starts with "Shared Javascript Library" AND exists mime fields whose("d3.min.js" = name of it) of it) ) | "<script src="https://cdnjs.cloudflare.com/ajax/libs/d3/3.5.17/d3.min.js"></script>" ) ?>
T: 0.125 ms
I: plural string

In order for this to work properly, the URL for the javascript library must contain a version number, and it must end with a file name ending in .js