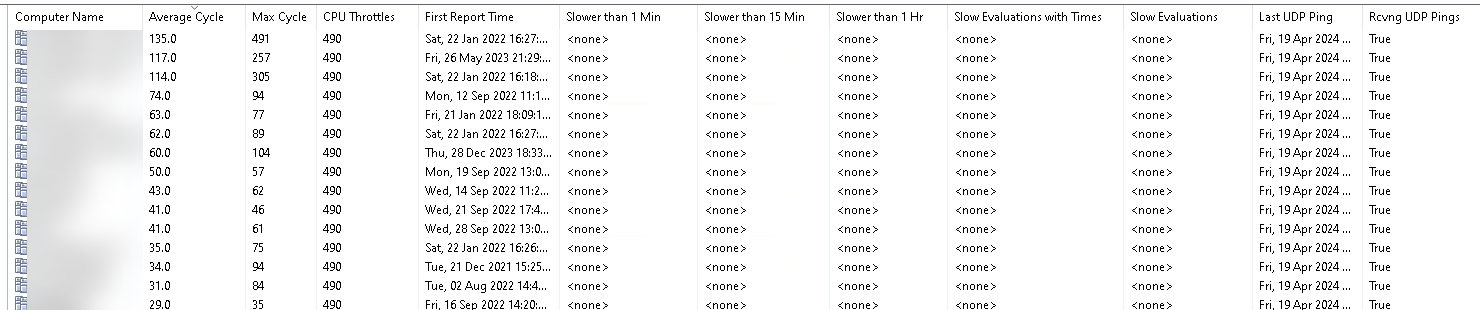
I am targeting my servers on this Analysis and I have some servers in the 100’s for Average Cycle and Max Cycle. From the screenshot all servers listed are on prem, one single hop away from the bigfix server (root and relay) with the exception of 3 that are hosted in the cloud. Also TCP\UDP 52311 is open and even some servers on the same VLAN as bigfix.
Now I assume that the times are in minutes, so in the picture above the first server has an average of 135 minutes with max cycle taking a whopping 490 minutes? If so, then why do the rest of columns with “Slowe than X” show no data? I would expect to the see the items that are causing such delay. The same goes for the rest of the servers (not pictured here) that fall within those “Slow than X values”. Also if I send an empty action to this particular server it receives the action within seconds, I would expect longer delay because of the cycle numbers that I am seeing.
There are times when servers take their sweet time to run an action, i.e.: patch Tuesday fixlets, so I want to pinpoint if servers are having evaluation delays by leveraging this report to get some additional insight on my servers.
When using this tracking it’s often important to check them “in aggregate”, working on improving the average evaluation cycles across all your systems. It’s easy for a small number of systems to skew the results, based on my experience I think that if a client suspends or goes to sleep while evaluating a property that entire sleep time might get included int hat duration calculation.
As for no fixlets showing in the ‘Slow Evaluation Times’, one thing I’d check is whether the client setting _BESClient_Resource_TrackingCount has a value on these systems. If it’s set to 0, then the slow evaluations won’t be tracked at all; by default the value is 10 slowest fixlets/properties are tracked if this setting doesn’t exist; I usually set it to 50 when I’m trying to check for slow evaluations.
It does look like your systems are getting UDP notifications, which is usually the first thing I’d check for ‘slow action processing’. The next thing is to enable Fast Hash Verification. This allows the client to accelerate the CPU throttle when calculating hashes for downloaded files - large Microsoft patches can take quite some time to verify hashes when the CPU throttles are at the default low values. See List of settings and detailed descriptions for reference but I’d recommend
I checked a few servers for the _BESClient_Resource_TrackingCount setting but they dont have it. We do have another eval running for workstations and they DONT have the above setting yet fixlets DO show up for workstations? Would this setting be specific to servers? I will try it with one server either way to see the results.
Thanks for the additional settings, checking the link and the description and I dont exactly understand how the miliseconds work with these settings.
_BESClient_Resource_WorkFastHashVerify
The BigFix client controls the CPU work limit, in fast evalutation mode. This setting shows the milliseconds of the CPU work.
What is exactly the “This setting shows the milliseconds of the CPU work.” I would assume this would be a percentage of CPU, can you help me understand these millisecond values?
If the TrackingCount setting is not configured then it should default to 10. From one of those machines, you could check for the tracked fixlets (regardless of how long they took to evaluate) using the Fixlet Debugger…be sure to “evaluate in client mode”. I think these times are in milliseconds
q: track fixlets of evaluationcycle of client
A: 163.497: Enterprise Security.502588501:Background Evaluation
A: 161.821: Enterprise Security.502588501:Background Evaluation
...

As far as the Work/Sleep settings, we have several different sets of these that behave similarly.  The most-used one are the "WorkIdle" and "SleepIdle", which is reported in your Analysis; these are what the client throttles for the usual background evaluation (i.e. no Action active, no UI presented, etc.)

Basically with WorkIdle/SleepIdle set at the default 10/480, the client will use the CPU for 10 milliseconds and then "sleep" or release the CPU for 480 milliseconds before starting again.  This works out to about 2% of a CPU (actually since the client is singlethreaded it is 2% of one CPU *core*)

If FastHashVerify is not configured, then the download hash calculation is also throttled to that 2% of one core.  If you enable the FastHashVerify settings, then the WorkFastHashVerify and SleepFastHashVerify settings are used while calculating download hashes; by default that is a 20 ms work and a 60 ms sleep, or about 25% of one CPU core while calculating hashes (and can also be tuned separatly by adjusing the Work/SleepFastHashVerify values)
Great explanation so to confirm, the WorkFastHashVerify and SleepFastHashVerify work together, and by going by their default values - WorkFast will work for 20ms and then SleepFast “takes over” and stops the client for 60ms…rinse and repeat until the hash is fully verified.
And we currently dont use the _BESClient_Resource_WorkIdle and _BESClient_Resource_SleepIdle setting so our client is only consuming 2% of the CPU at all times during the 10ms which the client is working, correct?
Lastly, I ran that evaluation and here’s the output
This server has office 2016 installed (application requirement) and all those ID’s happen to be Excel related patches. Question about the output, any way of getting the fixlet, analysis name instead of the ID?
And I misunderstood your TrackingCount setting…it’s not in use so default is 10, gotcha
edit:
just made the change to one of the servers to use _BESClient_Download_FastHashVerify = 1, I dont have to add _BESClient_Resource_WorkFastHashVerify and _BESClient_Resource_SleepFastHashVerify since by turning it on with the “1” it will default to 20/60. The only time to add those other two custom settings is if I want to increase 20/60 to let’s say 40/60?
@JasonWalker regarding the hash verification time, how long does a hash evaluation take? For example Server 2022 April CU is 414mb, I assume hash verification takes milliseconds to complete even if at the default 2% cpu usage.
I wouldn’t expect a 400 MB hash to take all that long, but there are a lot of variables between disk speeds, processor speeds, etc. that make it hard to give a good measure.
I was just thinking about your symptom (slow to run actions) with the screenshots you gave - my first thought would be “Not receiving UDP messages” but the analysis indicates you are getting those; you seem to have a fairly normal range of evaluation cycles with a few outliers (and we know the ‘average’ and ‘max’ times can get skewed with sleep/suspend); hash calculation would just be the next thing on my list.
Oh, something else to check - do you have any of the PowerSave or DeepSleep client settings configured? List of settings and detailed descriptions looking for _BESClient_Resource_PowerSaveDeepSleepEnable or _BESClient_Resource_PowerSaveEnable ?
Never seen those before, just spot checked some servers and not on there.
We do have the default 2% cpu usage, do most customers leave this default or they adjust as needed? I think we might be at a crossroad where it’s time to start adjusting all servers to increase usage at least to the next value of 5% (25/460). We have a very beefy environment from hosts, storage and backbone, doubt a 3% increase would cause any degradation. Or is there a way to just increase to 5% when an action is sent to the server and then back down to 2%?
Thanks
Edit: is the time in the evaluation in minutes or milliseconds?
The evaluationcycle of client is in milliseconds; the Analysis converts that into minutes by dividing by 1000 (milliseconds) and then by 60 (seconds) to end up in a Minutes result.
So this morning looking at the analysis and it seems like some servers which were reporting Last UDP and Receiving UDP Ping are now showing as not, is it expected to see this type of behavior on clients that were working perfectly and suddenly showing different behavior?
for example the two in yellow were originally showing as 2 of the 3 servers in the entire list showing , now I have 4 additional servers in the list.
Checking that property, the Analysis bases that result on reading the log files from the last two days. Maybe there were no UDP messages sent over the weekend to begin with? Try sending a new blank action and see whether the result changes – a “Send Refresh” to a few of the machines (and only a few) is a good way to both trigger UDP, and to report an updated result on this analysis.