HI Guys,
We have been struggling with this issue for quite some time now since we have started the importing of Sub_Capacity values via ILMT/BigFix REST API call ‘api/sam/license_usages’ for our customers.
I can’t expose the whole set of data from API and pvu_sub_capacity.csv (customer data) but here is a simple example for the product “IBM Business Monitor”
The API call ‘api/sam/license_usages’ is returning 11 unique rows while the pvu_sub_capacity.csv will return 8 rows.
Of the 11 rows returned by the ‘api/sam/license_usages’, only 03 rows have have values for both PVU_SUB_CAP and PVU_FULL_CAP. Rest of the 08 rows have incomplete capacity data.
On the other hand the 08 rows by the pvu_sub_capacity.csv is complete and have values for both PVU_SUB_CAP and PVU_FULL_CAP.
Both sources have only 03 rows in common.
Here are the sample data for the product “IBM Business Monitor”
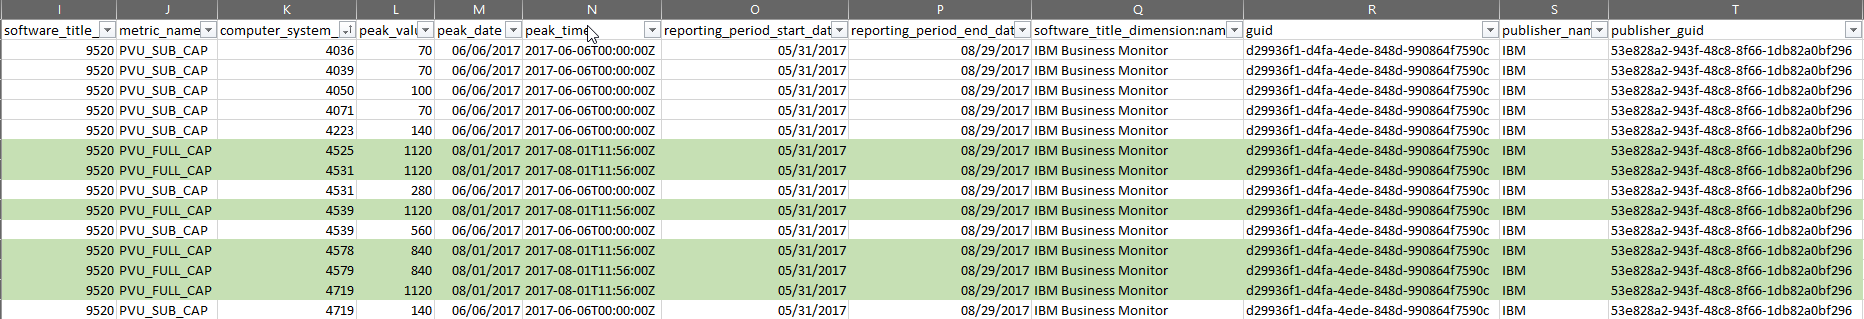
Reponse from the REST API ‘api/sam/license_usages’
“software_title_id”:9520,“metric_name”:“PVU_SUB_CAP”,“computer_system_id”:4036,“peak_value”:70,“peak_date”:“2017-06-06”,“peak_time”:“2017-06-06T00:00:00Z”,“reporting_period_start_date”:“2017-05-31”,“reporting_period_end_date”:“2017-08-29”,“software_title_dimension”:{“name”:“IBM Business Monitor”,“guid”:“d29936f1-d4fa-4ede-848d-990864f7590c”,“publisher_name”:“IBM”,“publisher_guid”:“53e828a2-943f-48c8-8f66-1db82a0bf296”}},
{“software_title_id”:9520,“metric_name”:“PVU_SUB_CAP”,“computer_system_id”:4039,“peak_value”:70,“peak_date”:“2017-06-06”,“peak_time”:“2017-06-06T00:00:00Z”,“reporting_period_start_date”:“2017-05-31”,“reporting_period_end_date”:“2017-08-29”,“software_title_dimension”:{“name”:“IBM Business Monitor”,“guid”:“d29936f1-d4fa-4ede-848d-990864f7590c”,“publisher_name”:“IBM”,“publisher_guid”:“53e828a2-943f-48c8-8f66-1db82a0bf296”}},
{“software_title_id”:9520,“metric_name”:“PVU_SUB_CAP”,“computer_system_id”:4050,“peak_value”:100,“peak_date”:“2017-06-06”,“peak_time”:“2017-06-06T00:00:00Z”,“reporting_period_start_date”:“2017-05-31”,“reporting_period_end_date”:“2017-08-29”,“software_title_dimension”:{“name”:“IBM Business Monitor”,“guid”:“d29936f1-d4fa-4ede-848d-990864f7590c”,“publisher_name”:“IBM”,“publisher_guid”:“53e828a2-943f-48c8-8f66-1db82a0bf296”}},
{“software_title_id”:9520,“metric_name”:“PVU_SUB_CAP”,“computer_system_id”:4071,“peak_value”:70,“peak_date”:“2017-06-06”,“peak_time”:“2017-06-06T00:00:00Z”,“reporting_period_start_date”:“2017-05-31”,“reporting_period_end_date”:“2017-08-29”,“software_title_dimension”:{“name”:“IBM Business Monitor”,“guid”:“d29936f1-d4fa-4ede-848d-990864f7590c”,“publisher_name”:“IBM”,“publisher_guid”:“53e828a2-943f-48c8-8f66-1db82a0bf296”}},
{“software_title_id”:9520,“metric_name”:“PVU_SUB_CAP”,“computer_system_id”:4223,“peak_value”:140,“peak_date”:“2017-06-06”,“peak_time”:“2017-06-06T00:00:00Z”,“reporting_period_start_date”:“2017-05-31”,“reporting_period_end_date”:“2017-08-29”,“software_title_dimension”:{“name”:“IBM Business Monitor”,“guid”:“d29936f1-d4fa-4ede-848d-990864f7590c”,“publisher_name”:“IBM”,“publisher_guid”:“53e828a2-943f-48c8-8f66-1db82a0bf296”}},
{“software_title_id”:9520,“metric_name”:“PVU_FULL_CAP”,“computer_system_id”:4525,“peak_value”:1120,“peak_date”:“2017-08-01”,“peak_time”:“2017-08-01T11:56:00Z”,“reporting_period_start_date”:“2017-05-31”,“reporting_period_end_date”:“2017-08-29”,“software_title_dimension”:{“name”:“IBM Business Monitor”,“guid”:“d29936f1-d4fa-4ede-848d-990864f7590c”,“publisher_name”:“IBM”,“publisher_guid”:“53e828a2-943f-48c8-8f66-1db82a0bf296”}}
{“software_title_id”:9520,“metric_name”:“PVU_FULL_CAP”,“computer_system_id”:4578,“peak_value”:840,“peak_date”:“2017-08-01”,“peak_time”:“2017-08-01T11:56:00Z”,“reporting_period_start_date”:“2017-05-31”,“reporting_period_end_date”:“2017-08-29”,“software_title_dimension”:{“name”:“IBM Business Monitor”,“guid”:“d29936f1-d4fa-4ede-848d-990864f7590c”,“publisher_name”:“IBM”,“publisher_guid”:“53e828a2-943f-48c8-8f66-1db82a0bf296”}},
{“software_title_id”:9520,“metric_name”:“PVU_FULL_CAP”,“computer_system_id”:4579,“peak_value”:840,“peak_date”:“2017-08-01”,“peak_time”:“2017-08-01T11:56:00Z”,“reporting_period_start_date”:“2017-05-31”,“reporting_period_end_date”:“2017-08-29”,“software_title_dimension”:{“name”:“IBM Business Monitor”,“guid”:“d29936f1-d4fa-4ede-848d-990864f7590c”,“publisher_name”:“IBM”,“publisher_guid”:“53e828a2-943f-48c8-8f66-1db82a0bf296”}},
{“software_title_id”:9520,“metric_name”:“PVU_FULL_CAP”,“computer_system_id”:4719,“peak_value”:1120,“peak_date”:“2017-08-01”,“peak_time”:“2017-08-01T11:56:00Z”,“reporting_period_start_date”:“2017-05-31”,“reporting_period_end_date”:“2017-08-29”,“software_title_dimension”:{“name”:“IBM Business Monitor”,“guid”:“d29936f1-d4fa-4ede-848d-990864f7590c”,“publisher_name”:“IBM”,“publisher_guid”:“53e828a2-943f-48c8-8f66-1db82a0bf296”}},
{“software_title_id”:9520,“metric_name”:“PVU_SUB_CAP”,“computer_system_id”:4719,“peak_value”:140,“peak_date”:“2017-06-06”,“peak_time”:“2017-06-06T00:00:00Z”,“reporting_period_start_date”:“2017-05-31”,“reporting_period_end_date”:“2017-08-29”,“software_title_dimension”:{“name”:“IBM Business Monitor”,“guid”:“d29936f1-d4fa-4ede-848d-990864f7590c”,“publisher_name”:“IBM”,“publisher_guid”:“53e828a2-943f-48c8-8f66-1db82a0bf296”}},
{“software_title_id”:9520,“metric_name”:“PVU_FULL_CAP”,“computer_system_id”:4531,“peak_value”:1120,“peak_date”:“2017-08-01”,“peak_time”:“2017-08-01T11:56:00Z”,“reporting_period_start_date”:“2017-05-31”,“reporting_period_end_date”:“2017-08-29”,“software_title_dimension”:{“name”:“IBM Business Monitor”,“guid”:“d29936f1-d4fa-4ede-848d-990864f7590c”,“publisher_name”:“IBM”,“publisher_guid”:“53e828a2-943f-48c8-8f66-1db82a0bf296”}},
{“software_title_id”:9520,“metric_name”:“PVU_SUB_CAP”,“computer_system_id”:4531,“peak_value”:280,“peak_date”:“2017-06-06”,“peak_time”:“2017-06-06T00:00:00Z”,“reporting_period_start_date”:“2017-05-31”,“reporting_period_end_date”:“2017-08-29”,“software_title_dimension”:{“name”:“IBM Business Monitor”,“guid”:“d29936f1-d4fa-4ede-848d-990864f7590c”,“publisher_name”:“IBM”,“publisher_guid”:“53e828a2-943f-48c8-8f66-1db82a0bf296”}},
{“software_title_id”:9520,“metric_name”:“PVU_FULL_CAP”,“computer_system_id”:4539,“peak_value”:1120,“peak_date”:“2017-08-01”,“peak_time”:“2017-08-01T11:56:00Z”,“reporting_period_start_date”:“2017-05-31”,“reporting_period_end_date”:“2017-08-29”,“software_title_dimension”:{“name”:“IBM Business Monitor”,“guid”:“d29936f1-d4fa-4ede-848d-990864f7590c”,“publisher_name”:“IBM”,“publisher_guid”:“53e828a2-943f-48c8-8f66-1db82a0bf296”}},
{“software_title_id”:9520,“metric_name”:“PVU_SUB_CAP”,“computer_system_id”:4539,“peak_value”:560,“peak_date”:“2017-06-06”,“peak_time”:“2017-06-06T00:00:00Z”,“reporting_period_start_date”:“2017-05-31”,“reporting_period_end_date”:“2017-08-29”,“software_title_dimension”:{“name”:“IBM Business Monitor”,“guid”:“d29936f1-d4fa-4ede-848d-990864f7590c”,“publisher_name”:“IBM”,“publisher_guid”:“53e828a2-943f-48c8-8f66-1db82a0bf296”}},
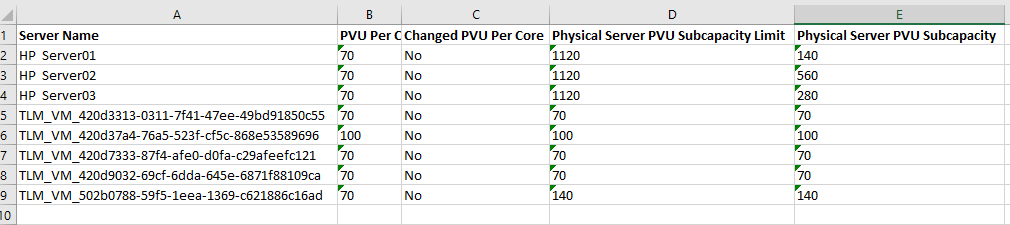
**Data from the pvu_sub_capacity.csv for the same product
**
Does anyone know why we get such different set of data for these two sources and how to resolve this?
Any insight on this will be really appreciated
Thanks
Hameed