Hey all,
One thing that's always been a challenge with BigFix is that every customer defines "mean time to remediation" differently — some measure it from content release to patch complete, others from when the endpoint noticed the patch to patch complete. The data to answer either question is already sitting in the BigFix database, but getting it into a report that's actually useful for management has historically meant either learning BIRT/HTML reporting yourself or finding someone who already knows it.
I'm not a developer and don't write HTML, so I used Claude (Anthropic's AI) to build a Failed Action History dashboard on top of BigFix Web Reports. It took about 30 minutes. The dashboard:
- Surfaces failed actions across both baselines and ad hoc actions
- Translates exit codes into plain-English explanations (with suggested fixes)
- Separates genuine failures from pending restarts and resolved issues, so you're not chasing false positives
- Lets you filter by OS, device type, and patch, and drill into any endpoint with a click
- Exports to CSV/PDF
BigFix is the delivery mechanism — it doesn't write the patches, but it delivers them efficiently, and this dashboard is meant to show exactly where that delivery is succeeding or breaking down.
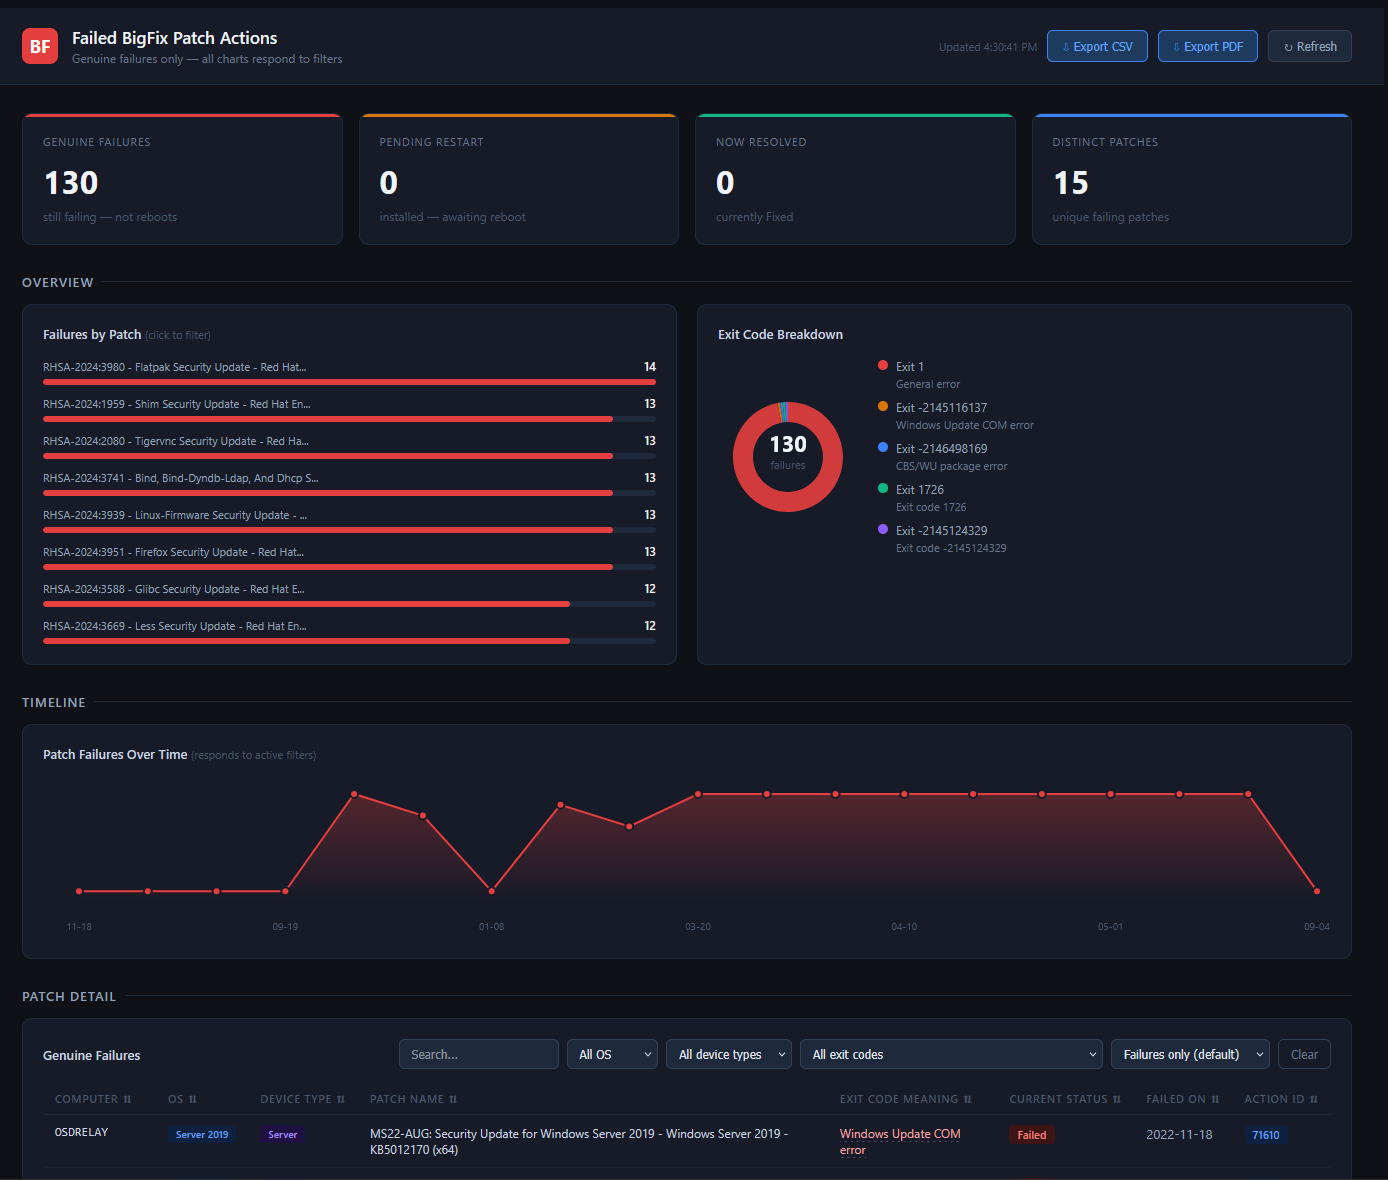
I wrote up the full walkthrough and included the relevance queries and code here: BigFix - Failed Action History Report
Feel free to use it as-is or tweak it for your environment. Curious if others have built similar reports and what approach you took — always looking to improve this.
Also, if you're interested in this kind of thing, BigFix Masters Class (Americas) is October 13–15, 2026: Register Now BigFix Master Class for Americas - October 13-15 2026!