We have all been there. You activate a new Analysis or deploy a Custom Site to gather data, not realizing the massive impact it might have on your endpoint performance. Sometimes we activate things in BigFix without knowing the true cost it can cause on an environment.
To solve this, I wrote a step-by-step guide on building a custom Web Reports dashboard that maps out your exact client evaluation loop.
This tool translates raw database IDs into plain English and highlights the exact properties and Fixlets dragging down your servers. It helps you look at your active content and determine: is the juice worth the squeeze?
With this level of visibility, you can easily prioritize which Analyses are actually necessary, or pinpoint exactly which relevance statements need to be rewritten so they do not impact your environment so much.
Check out the full article and source code below to build it in your own environment.
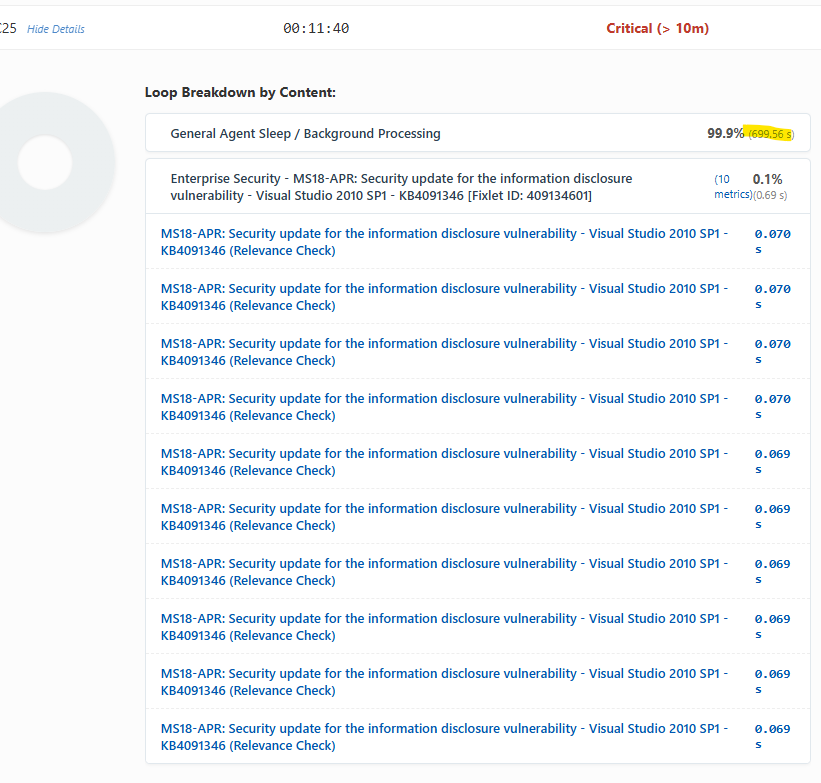
I’ve got this installed and configured but don’t understand the results. In all instances it shows that “General Agent Sleep / Background Processing” has taken the most amount of time. What are we supposed to do with that?
So the best way to explain that is the agent is lightweight and uses 2% of the CPU or less by default. So that means the agent is sleeping about 99% of the time and then when it wakes up it evaluates the content. The idea behind this was i wanted to identify if i had custom content that was causing a delay in the client evaluation. In the report there should be a filter for custom sites. That will help you identify custom content causing a delay.
That's helpful...I wanted to ask whether I'm interpreting this correctly overall...
This system is tagged as "critical' because the eval loop is over 10 minutes in duration; and the client is spending 99% of it's time (699 seconds of the loop) idling. The label says "Sleep / Background", but is there a way to distinguish?
Spending 99% in sleep with a long loop might imply to me that I could give it a higher CPU allocation to evaluate faster, or everything is fine and I don't need to do anything. But a long loop with 99% in Background Evaluation implies to me I might have some Fixlets with expensive relevance evaluating in the background?
If I have a lot of content enabled, I don't think a ten minute evaluation loop is all that bad?
I am in the process of adjusting this to use the data from the client profile tool data. This will get the data from that and update the results. This data seems to be the last client evaluation and not so much an average. It did help me pinpoint an issue with content in my lab that was putting a drain. Ill update the article once i get a better version. Thanks for the feedback