I am using the built in property “installed application - windows” and exporting the report to a .csv using Web Reports. The report lists all the applications into 1 row (excel row 1b), is it possible to the applications listed in individual rows oppose to having them all listed in 1 row?
Yep!
In web reports press, “Edit Columns” under the computers section and press the, “+” next to the name of your property. This will make a row for every single result of the property.
When you export it you should have the view you’re looking for!
Let me know if this isn’t what you’re looking for!
3 Likes
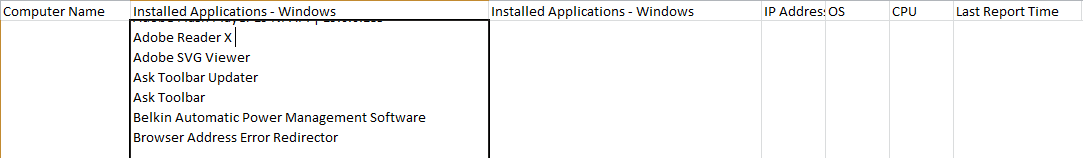
Thanks for the quick reply strawgate! The results of the property are listed in 1 cell in excel. Is there any way to have each result in a separate cell? I attached a screenshot of the current export.
Thanks!
The instructions I provided above will make a row for each installed application instead of putting it all in one cell.
Then when you export to CSV each application will have its own row.
1 Like
Thanks for the help!
What would the recommendation be for reporting on 1000+ machines? I’m not going to click the + sign on each one before I export the data…
Read the instructions from strawgate again. He’s clicking the ‘+’ on the property name when adding the column to the report, not the computer. It’s just choosing which properties to create a separate row and which to wrap in a single cell.
Yes I found a clearer explanation on another forum post thanks.