I am seeing an odd behaviour with Historical Charts in 9.5.4/9.5.5, and I’m curious if anyone has seen/are seeing something similar.
We have been using historical charts in 9.2.7 and prior versions with great success, but have since upgraded our production environment to 9.5.4 (our dev environment running 9.5.5 exhibits the same issue). I have been reviewing some of my stored reports recently and noticed that the charts are no longer obeying the date range specified in the UI.
Instead, the earliest dates of content relevance is being used, resulting in charts that can go back almost a decade (Microsoft security updates are a good example of this).
For example:
Using a content filter for content whose name starts with MS17 for a single computer in my environment will yield the following chart regardless of what date range I specify:
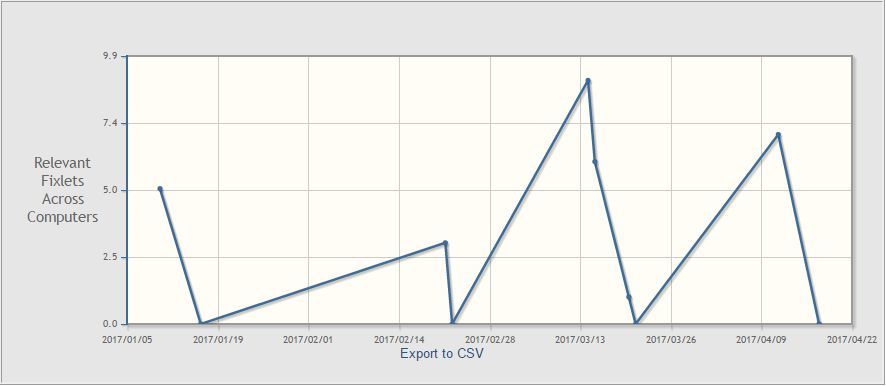
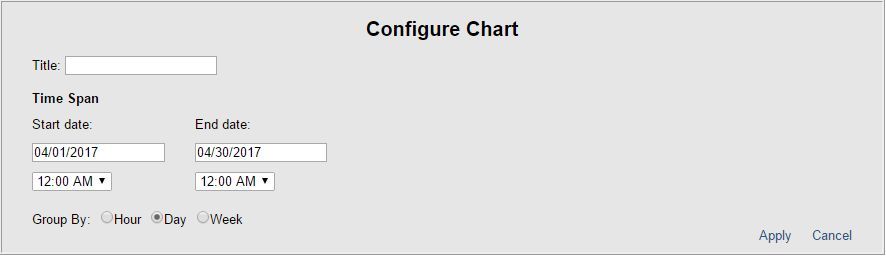
In this case I specified to only show the date range from April 1st to April 30th (see below), yet the chart displays information going back to early January.
The graph itself is correct, as the machine reports relevant for MS17 security updates as per the Microsoft release cycle and our internal patch cycle, but the date range is not obeyed. I’ve reviewed the page source with little luck, and I’m not quite sure how to even begin troubleshooting this.
Anyone else seeing this and/or have any thoughts on how this can be resolved?