I created this topic to gather feedback on the BigFix Query tool in the WebUI, which looks like this:
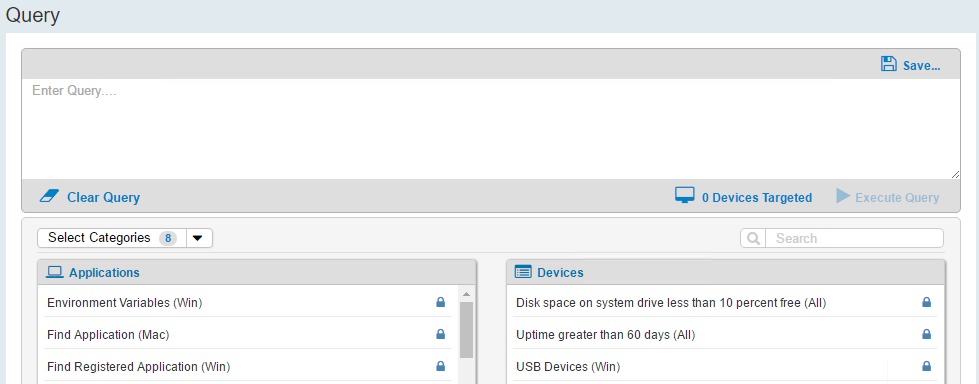
CC: @AaronBauer @bradfish
I created this topic to gather feedback on the BigFix Query tool in the WebUI, which looks like this:
CC: @AaronBauer @bradfish
Generally, I want to be able to more easily select devices that have a last report time that is fairly recent, as these devices are more likely to be online and report back results. (within the last 45 min)
It would also be nice to have computers that have a “last command time” value within the past week highlighted in some way, because it can be reasonably assumed that these devices are getting UDP notifications. ( I could make an automatic group to help with this, but it isn’t an ideal solution if I already want to query a different automatic group )
Also, for BigFix infrastructure with a rather high number of endpoints, I’m generally going to want to start by selecting an automatic group, not individual endpoints.
It would also be useful if the last targeting criteria was sticky so that I didn’t have to reselect the last used computers every time I open the tool.
It would be useful if my most recent queries were shown in a list, at least for that session so I could easily re-run them.
It would be interesting if the results page for a query would give a running summary of the results, irrespective of the computers that returned them, with the details of the computer/result pair listed below. If I query 1000 machines, I care much more about the unique results and the count of each result, and I care very little about which computer the result actually came from.
It would also be useful if more of the out of the box suggested queries were more cross platform. Some queries can just be fairly cross platform, while others would require a compound relevance statement like: if mac of operating system then "this" else "that"
Here is a cross platform example of how to query the hosts file: https://bigfix.me/relevance/details/3017247
lines whose (it does not start with "#" AND it as trimmed string does not equal "") of files "hosts" of (folders "/private/etc"; folders "/etc"; folders "C:\Windows\System32\drivers\etc"; folders "C:\Windows\sysnative\drivers\etc")
Also, the following query gives the result No Inspector Context which is odd: last command time of client
It would be interesting to see this added to the default query options:
now - minimum of subscribe times of sitesunique values of brand strings of processorsThere should be some interesting stuff that could be queried using SMBIOS for Win/nix and IOReg on Mac that could be combined into a cross platform query.
Thanks James for your comments on BigFix Query.
==> The first release of Query supported manual computer groups and individual endpoints, we are planning to add automatic/dynamic group support to the next release of Query.
==> Definitely agree, we are moving some Query R1 OOTB queries to be cross-platform, and for new queries we’re looking to see if it makes to create them as cross-platform queries.
==> I get that message when I run that query in the Query UI as well as via the local qna.exe (on Win), so the Query UI is returning the same as local qna as expected. Sounds like you had an expectation this query should return valid results, check to see if you get valid results running the query locally.
==> I like this one, plan to include in Query R2. The “%” also doesn’t show correctly when executed through qna.exe (we pretty much pass thru the qna results, fixing formatting where we can, we’ll look at this one further)
==> The predefined queries to date haven’t been BigFix deployment specific like this one, may be we should consider an OOTB category called ‘BigFix Deployment’ or something like that.
==> I don’t get any data back on this query when run in either qna or Query UI, need to look at this closer and see what you’re trying to do here.
==> I like this one as well, plan to include in Query R2.
==> Will need to work on these.
RE: https://bigfix.me/relevance/details/2999325
This only works if you run the query against machines that have had failed deployments with a non-zero exit code. It might be windows only, not certain, but it definitely gave me results either on the alpha site, or my test deployment when I tried it.
The query is not very well optimized. Something I wrote a long time ago, try this instead:
unique values of lines containing " (Exit Code=" of files whose(12 = length of name of it AND name of it as lowercase ends with ".log" AND exists lines of it) of folders "Logs" of folders "__Global" of ( (folders "/var/opt/BESClient/__BESData");(folders "/Library/Application Support/BigFix/BES Agent/__BESData");(folders "BigFix Enterprise\BES Client\__BESData" of folders whose(name of it starts with "Program Files") of folders "C:"))
How do I increase the timeout for eval time of BFQueries?
What controls the CPU usage when evaluating a BFQuery? Ideally I’d like it to use more than the default.
The % escaped characters do show correctly in the console and in the fixlet debugger, but not in the raw QNA text result. It might be valuable to have BFQuery return the correct “unescaped” % character as well as any other similar characters by default, but it may also be useful to have a way to switch it into a RAW mode for advanced users like myself that want to debug the output. I do switch back and forth between these modes in the Fixlet Debugger.
So BFQuery runs only in the local QNA context, which means it doesn’t wait for or interrupt the client eval process, but that also means it can’t run anything that requires the client context in order to eval.
I don’t think I fully realized this until now. This is a slightly annoying limitation in some cases.
The product will of course continuously advance so we could be addressing this at some point soon.
I edited your forum post for clarity and formatting, mostly using the “quote” tool. (select text in another post, then click the quote reply button that appears while writing a post)
It definitely takes time to learn all the markdown tricks and the forum software nuances.
I would LOVE it if BFQuery would return not just the result, but also the eval time for the query. This would be HUGE for my testing of new relevance statements. Sure it is fast on my test system with an i7 CPU, 16gb of RAM and PCIE SSDs, but what about the 5 year old computer elsewhere with a spinning hard drive?
It is not too difficult to compare the speed of different relevance statements on the same machine in most cases, but it is very hard to get a good idea of what the speed of the relevance evaluation is across multiple computers.
Showing the eval time could be hidden & not collected by default; only shown to those that enable it.
The server computes a query time which is accessible through the REST APIs, it is not exposed in the WebUI. However it is an ‘end-to-end’ time from when the query submitted until when the result is stored in the database, so it includes all the propagation times from the server to the endpoint and back. It sounds like maybe what you’re looking for is just the time it took for the endpoint to evaluate the relevance. We currently don’t calculate and store this time (technically it could of course be done, would require changes to both the server and the agent).
Yes, this is definitely what I want.
This is much less than ideal, and it should probably not be presented to the typical user because it would be misleading, however it could still be useful in some limited testing scenarios.
The endpoint can definitely produce the value just like QnA does now but getting it back through the system is the harder part
Thanks for the additional information, agree it would useful. I’ve asked that we create work items for the ability to collect and display the time it took for each client to execute the relevance such that the time should probably only be displayed to admins, and/or configurable as to whether it should show or not.
If you do collect the time that the relevance eval takes for QnA and are able to display it similar to the fixlet debugger, then I personally would always show it so that you have a measure of the impact you are having, BUT I can definitely see why it would be configurable to show or not.
Do you know if the latest patch (9.5.5) has capability in the webui to evaluate queries against the client?
I assume you mean evaluating queries against the client context… no that has not yet been added into BigFix Query but it is on the list of things we want to deliver at some point.
Yes, thank you for translating 
Okay, thank you for the information.